Recent news:
Study in Nature investigates the tidal pulse of coastal rivers

A cross-disciplinary study led by DGFI-TUM reveals the characteristics and extent of tidal influence in over 3,000 coastal rivers worldwide. Based on wide-swath observations from the Surface Water and Ocean Topography (SWOT) satellite, this is the first study to evaluate the propagation of ocean tides in rivers on a global scale.
The findings of the study effectively capture the pulse of the rivers and led to the creation of the first-ever global atlas of tidal extent in coastal rivers. Ocean tides play a vital role for the global climate and ocean circulation. In the coastal zone and in estuaries, their role is incredibly significant to a wide variety of processes and communities, including flooding, freshwater availability, ecosystem functioning, and sanitation. The findings now allow to map where and how far tides play an important role upstream of rivers. These results have major downstream applications across these processes and for protecting and mitigating against changes within these systems. This is particularly relevant in remote regions with limited local knowledge.
Previously, the role of tides in rivers was limited to regions where local observations from river tide gauges or high-resolution numerical models were available. In this study, advanced measurements from wide-swath satellite altimetry were used to map the extent of tides in all rivers, providing crucial insights into rivers where models or observations were unavailable. Using this information, it was estimated that over 700 million people are influenced by ocean tides within rivers, while 2.5% of the global agriculture lies within 3 km of a tide-influenced river. Details of the study can be found in the recent article Observing the tidal pulse of rivers from wide-swath satellite altimetry (Nature, 2026, DOI: 10.1038/s41586-026-10287-z). A visualization and interactive map is available here.
Abrupt change in the rate of global sea‑level rise

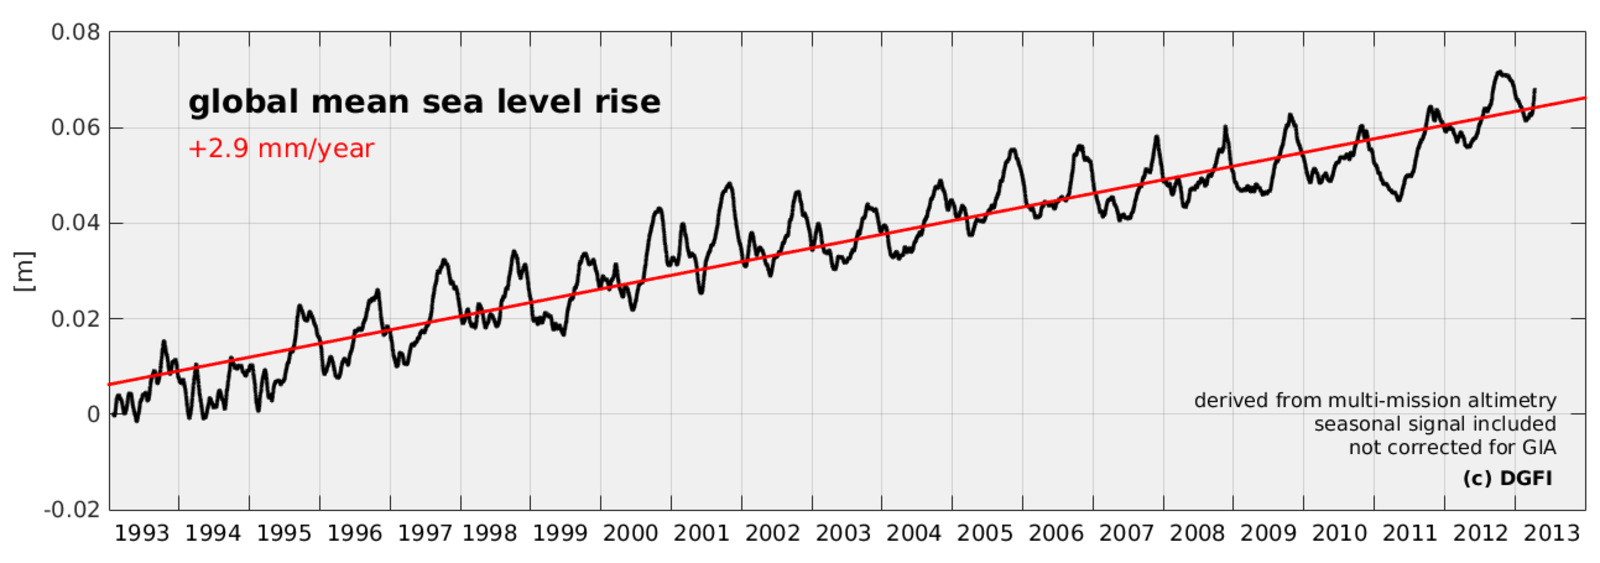
As part of the ESA Sea Level Climate Change Initiative (SL_cci), DGFI-TUM has contributed to a new study revealing a sudden jump in the rate of global sea‑level rise in the early 2010s. This shift is visible not only in the sea‑level record itself, but also across several climate variables that influence it.
By carefully analyzing 30 years of satellite altimetry data, researchers found that the oceans were rising by about 2.9 millimeters per year until 2011. After that, the rate abruptly increased to about 4.1 millimeters per year, a sharp acceleration occurring over just a year or two. One likely contributor is the Pacific Decadal Oscillation (PDO), a long‑term pattern of warming and cooling in the Pacific Ocean. Around 2011, the PDO shifted phase, affecting rainfall patterns, ocean currents, and how heat is stored in the ocean. This timing corresponds closely to the observed jump in sea‑level rise. Other parts of the climate system also changed around the same time: ocean heat content began rising more rapidly, land water storage shifted, and even atmospheric circulation patterns influencing ice melt and ocean dynamics underwent noticeable changes. Together, these signals suggest a broader climate regime shift in the early 2010s. More information about the study can be found in the open access article Abrupt trend change in global mean sea level and its components in the early 2010s (Nature Communications Earth & Environment, 2026, DOI: 10.1038/s43247-025-03149-5).
Although the precise cause is still being investigated, the key message is clear: sea‑level rise can change abruptly, not only gradually. Detecting such shifts is essential for coastal regions preparing for future changes. To identify this trend change, scientists used two independent detection methods—one of which was DiscoTimes, an open‑source algorithm developed at DGFI-TUM to detect discontinuities and nonlinearities in geophysical time series.
Marcello Passaro receives ESA Earth Observation Excellence Award 2025

Dr. Marcello Passaro from DGFI-TUM has been honored with the prestigious ESA Earth Observation Excellence Award 2025. The award was presented during the ESA Living Planet Symposium in Vienna, recognizing his outstanding contributions to satellite altimetry and oceanographic research.
Marcello’s work focuses on developing advanced algorithms to improve the accuracy and usability of satellite altimetry data, particularly in challenging marine environments such as coastal zones, sea ice regions, and storm-affected areas. His research addresses the complexities of measuring sea level changes and wave heights near coastlines, areas that are critical for understanding climate impacts on populations and infrastructure. Using data from ESA and other space agencies, Marcello has led the development of global, multi-mission altimetry products, including the DGFI-TUM's OpenADB ALES datasets. These tools have enabled unprecedented insights into sea level rise, tidal modeling, and wave energy distribution in coastal regions. His innovative approach has significantly advanced the fields of oceanography, climate science, and coastal engineering. His contributions also extend to ESA’s Sea Level Climate Change Initiative and Sea State Climate Change Initiative, where his algorithms help refine satellite measurements for both open ocean and nearshore environments. The award is endowed with prize money of €35,000 to support his continued research.
DGFI-TUM is sailing for One Ocean
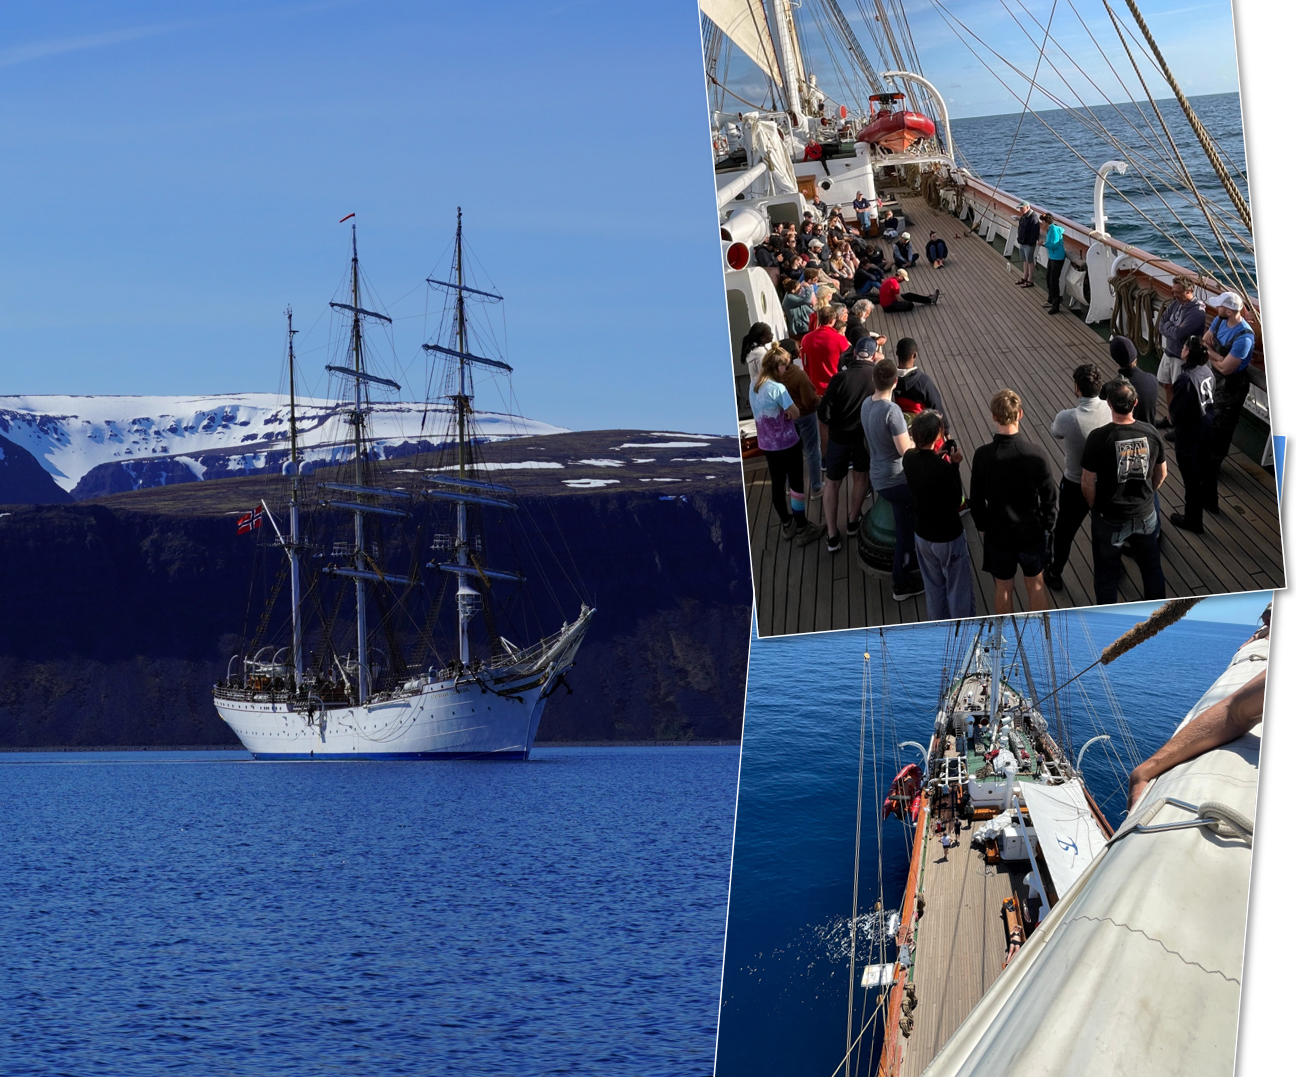
Between April and June 2025, two DGFI-TUM scientists participated in the ESA Advanced Training Course, which is part of the One Ocean Expedition, a scientific and educational voyage around the northern hemisphere oceans. A unique program organized by the European Space Agency combined practical oceanography with traditional sailing aboard the Norwegian tall ship Statsraad Lehmkuhl.
Students from 28 countries, along with teachers, scientists, and sailors, took part in the voyage that began in Tromsø (Norway) and led through Arctic waters to Reykjavík (Iceland). From there, the journey continued southward through the Strait of Gibraltar into the Mediterranean Sea, with stops in Mahón (Spain) and ending in Nice (France), just in time for the UN One Ocean Conference 2025.
On board, the interdisciplinary crew engaged in a unique combination of daily sailing routines and environmental observations, including continuous measurements of current velocities with an Acoustic Doppler Current Profiler (ADCP), echo sounder observations, and water properties. In addition, 31 science stops were conducted that included CTD casts, net deployments for plankton and microplastics, and drone flights, all collocated with satellite data to study ocean features such as eddies in the Lofoten Basin and Mediterranean Sea, internal waves, and phytoplankton blooms. Argo floats and drifters were also deployed during the voyage, contributing to the in-situ datasets, which were analyzed together with various satellite data on sea level and ocean currents from altimetry, as well as temperature, salinity, and ocean color.
Sailing over 4,500 nautical miles, the participants experienced the ocean’s beauty - accompanied by whales in the Arctic and dolphins in the Mediterranean - and its power during storms with waves reaching up to 6 meters. At the same time, they observed its vulnerability through a marine heatwave observed by satellite and in-situ data in the North Atlantic and visible oil spills and plastic pollution near the coast. The floating university connected students and scientists, provided a unique platform for research and outreach and incited inspiration and engagement for the ocean among participants.
Satellite altimetry reveals Chukchi Sea circulation and flow reversals in the Bering Strait
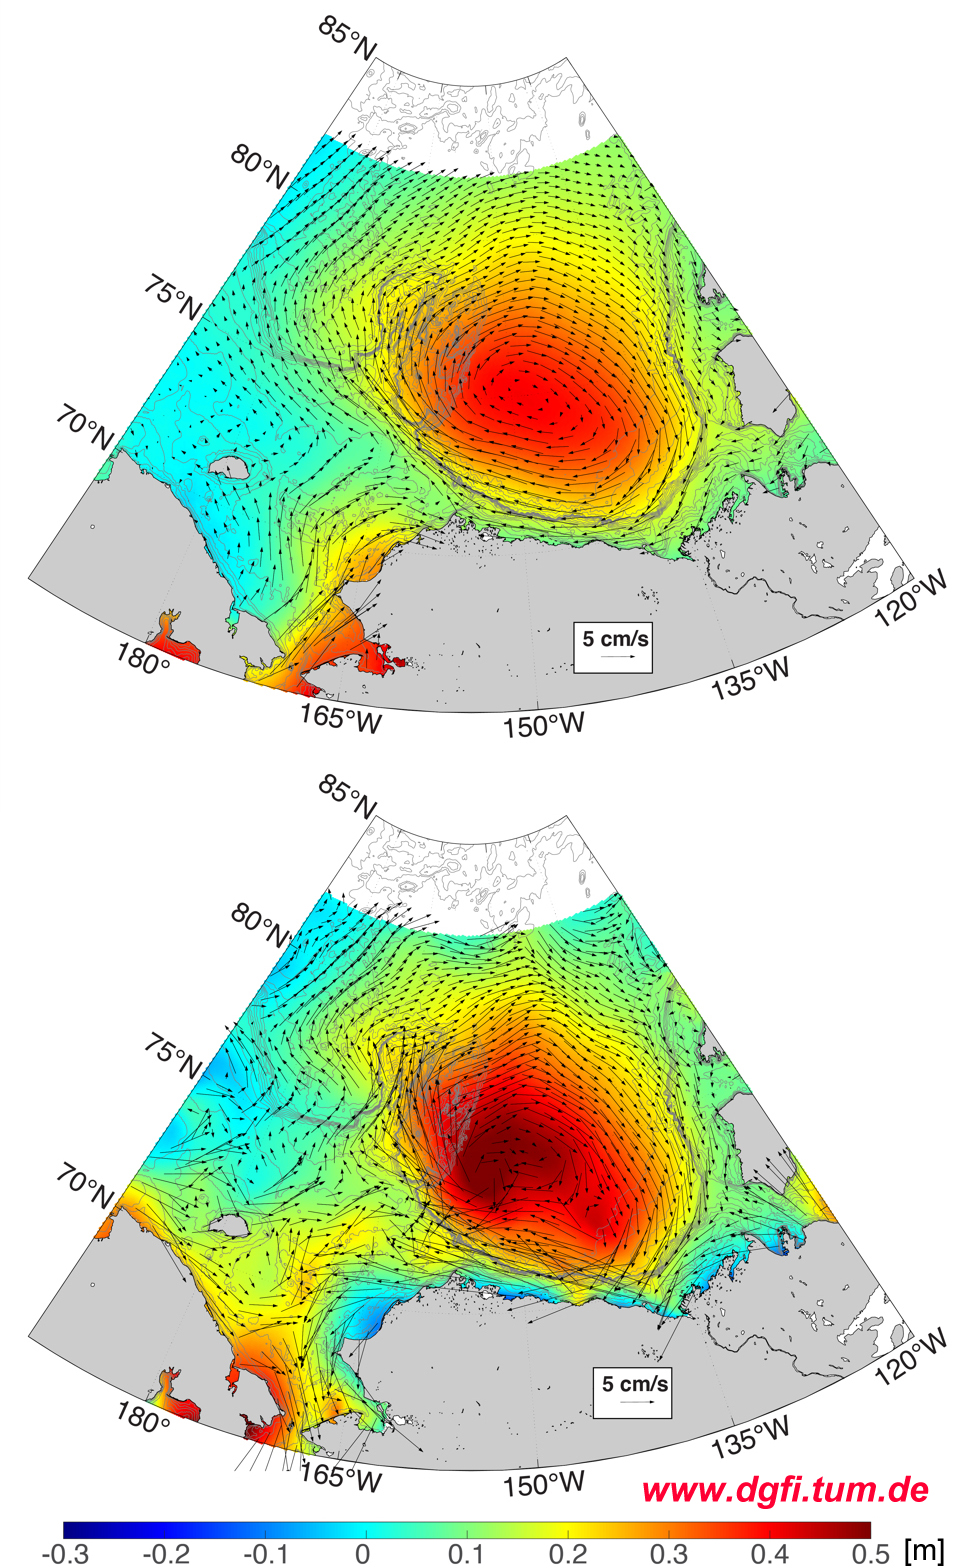
Pacific waters enter the Arctic through the Bering Strait and carry heat, freshwater and nutrients into the Chukchi Sea. With its precise observations of the sea surface on various spatial and temporal scales, satellite altimetry provides valuable monitoring data of this key transition zone. They are of vital importance for understanding the dynamics of the Arctic Ocean, especially in a changing climate.
The use of advanced algorithms to determine sea level in the ice-covered ocean has resulted in a high-resolution (10 days, 8 km) dataset of the dynamic ocean topography (DOT) and geostrophic currents for the region. It effectively captures the major circulation patterns, including the Bering Strait throughflow, the Alaskan Coastal Current, the Beaufort Gyre, quasi-permanent circulation features, such as Beaufort Shelfbreak Jet and Siberian Coastal Current, as well as synoptic-scale processes. Reversals of the northward flow through the Bering Strait were documented over 2013-2023 and were associated with anomalously strong northeasterly storms over the Chukchi Shelf. The response of along-strait flow to strong northerly winds is particularly pronounced in the ice-free autumn period and remains well correlated under partial ice cover during winter and spring. The results suggest that a decline in ice cover and a shift in atmospheric patterns may lead to more frequent flow reversals, potentially altering circulation patterns across the broader region. Details can be found in the article Chukchi Sea circulation and Bering Strait flow reversals from reprocessed satellite altimetry (Ocean Dynamics, 2025, DOI: 10.1007/s10236-025-01672-9).
Coherent Modes of Global Coastal Sea Level Variability
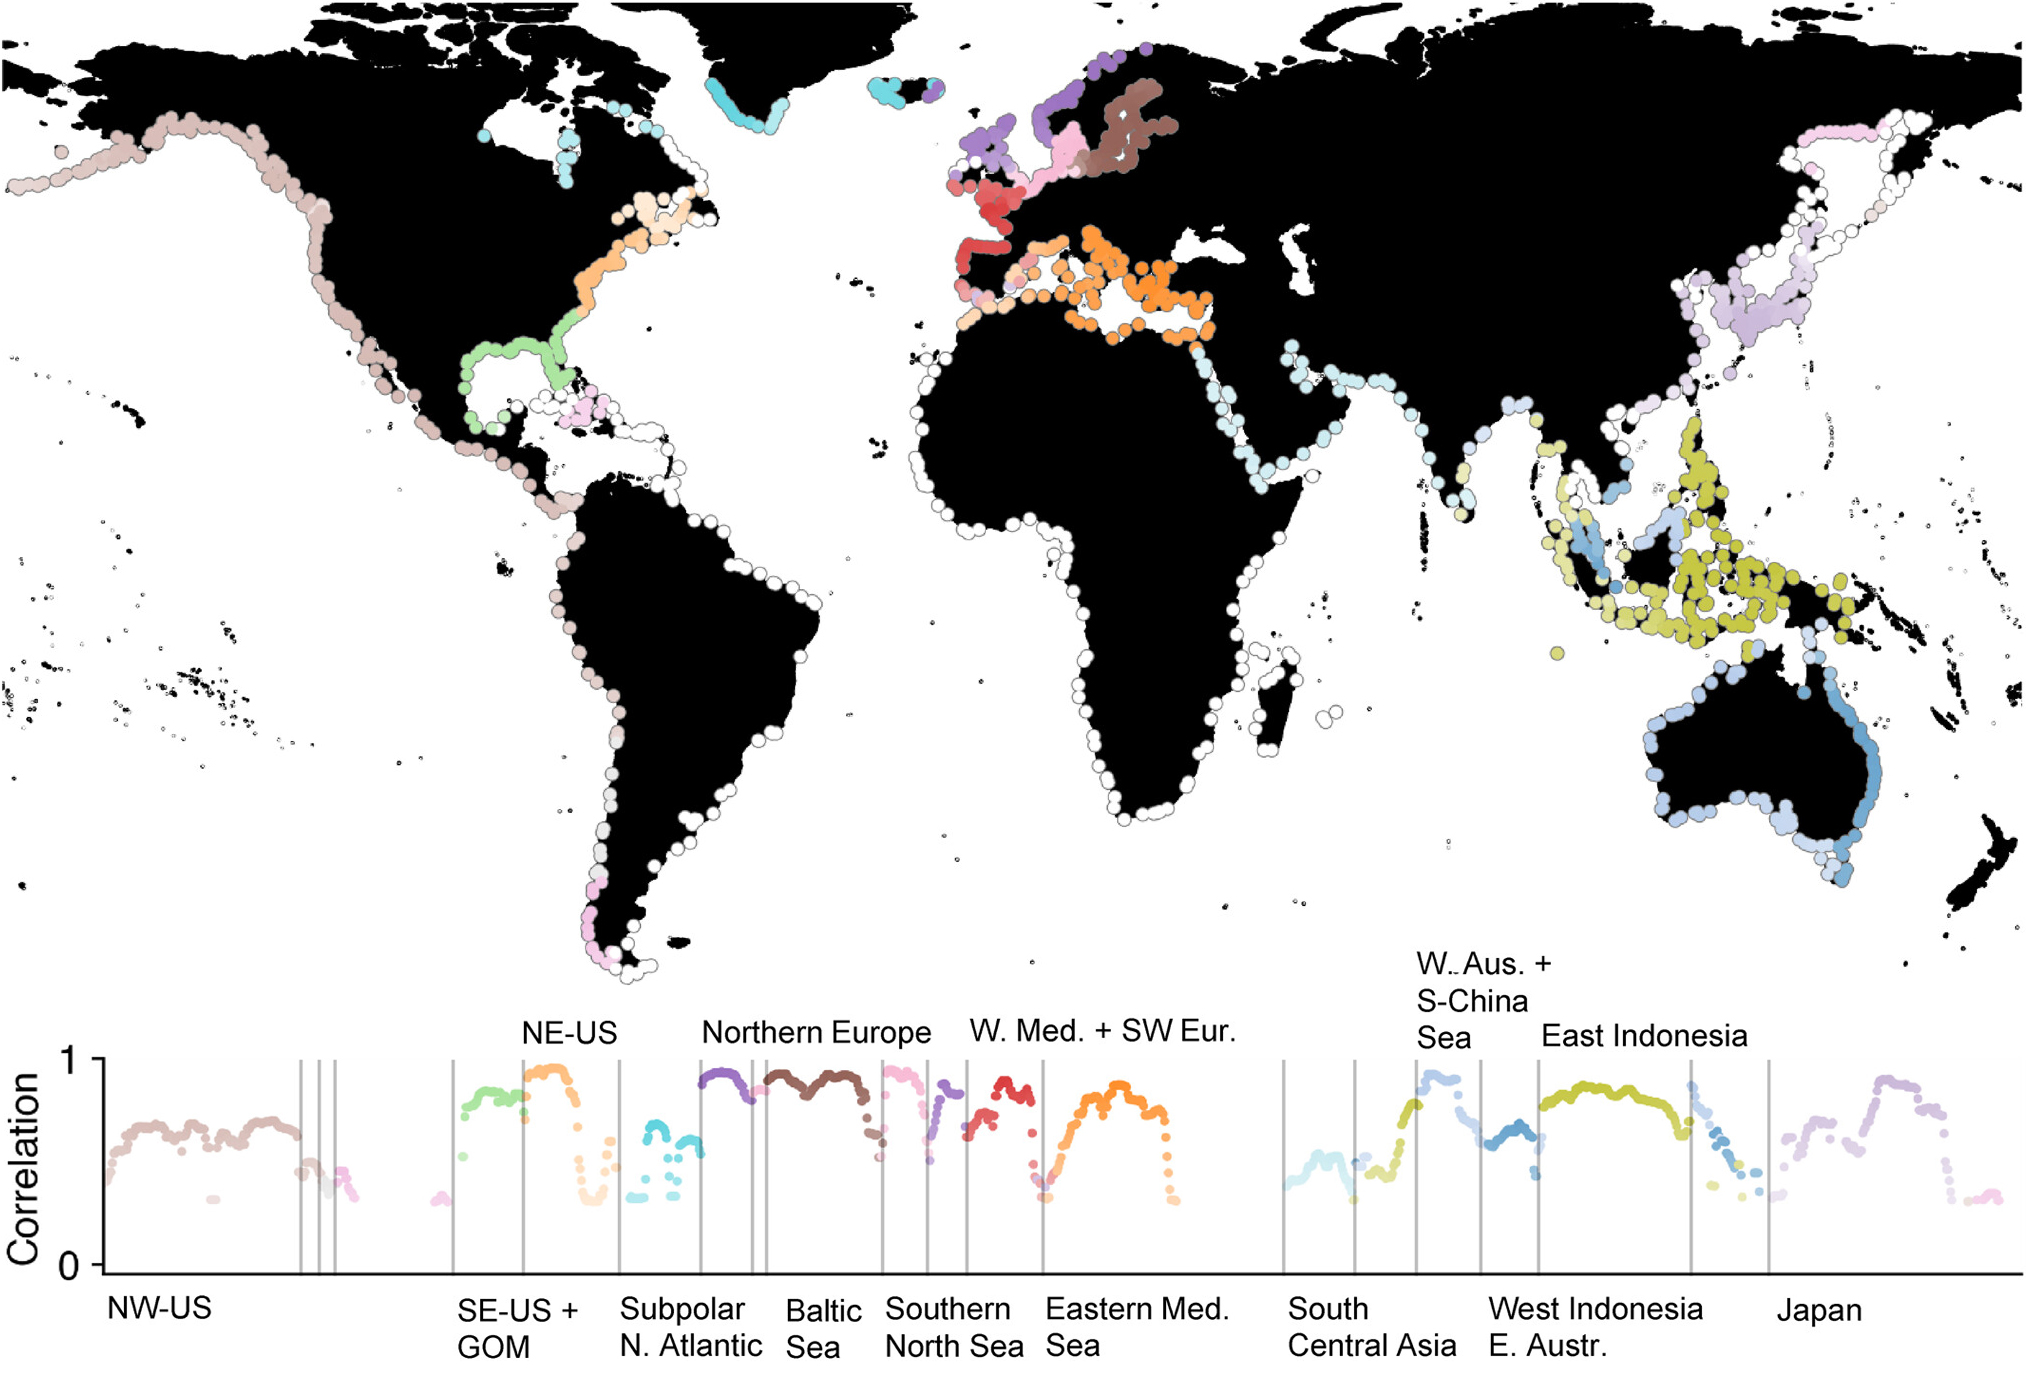
Sea level variability on the coasts can differ considerably from sea level variability in the open ocean. This difference is mainly due to the presence of the continental slope, shallow waters and coastlines. However, coastal sea level variability is often strongly correlated over large distances, indicating persistent and recurrent spatiotemporal variations along the world's coastlines. The geographical distribution of these “coherent modes” has not yet been objectively investigated on a global scale. Previous studies have often relied on sparsely distributed tide gauges or gridded altimetry and have not yet incorporated dedicated coastal altimetry processing.
By using a Bayesian mixture model and complementing the sparse tide gauge data with coastal altimetry, large-scale patterns of coherent modes of monthly coastal sea level variations have now been identified. Much of the observed variability can be described by a relatively small number of cluster time series and thus be attributed to a set of common drivers. This knowledge of the predominant modes of variability is valuable for future investigations aiming to better understanding the underlying drivers, the (de)coupling of coastal and open ocean variability, and the associated implications on estimates of past and future coastal sea level changes. Details are provided in the publication Coherent Modes of Global Coastal Sea Level Variability (Journal of Geophysical Research - Oceans, 2024, DOI: 10.1029/2024JC021120).
Coastal ocean tides from SWOT wide-swath satellite altimetry
Ocean tides are a key component of ocean dynamics, and their precise knowledge is relevant for a variety of applications. Over the last decades, models have continued to improve, but limitations remain in coastal environments, where tidal dynamics are complex and satellite observations less reliable. A new study, led by DGFI-TUM and performed in cooperation with international partners, now takes advantage of the wide-swath altimetry data from the Surface Water and Ocean Topography (SWOT) satellite.
The study concentrated on two complex coastal regions with varying tidal characteristics, the Bristol Channel (UK) and the Long Island Sound (USA). Here global models and along-track altimetry have traditionally struggled. Nearly three months of the 1-day Calibration and Validation (Cal/Val) phase of SWOT were used to derive the major M2 tide. Comparisons with global models and in-situ measurements demonstrated unprecedented spatial variability captured in these coastal regions by SWOT, which provided high levels of accuracy compared to in-situ measurements. Additionally, a fully-focused SAR (FFSAR) pass was evaluated in the Bristol Channel, which in itself is a novel result, demonstrated an advanced retrieval of tidal characteristics in the near coastal regions and supported the estimations made from SWOT data.
These insights strongly motivate the incorporation of the wide-swath data into future tide models, allowing for continued developments in coastal altimetry. The study is published in the article Tides in complex coastal regions: Early case studies from wide-swath SWOT measurements (Geophysical Research Letters, 2024, DOI: 10.1029/2024GL109983).
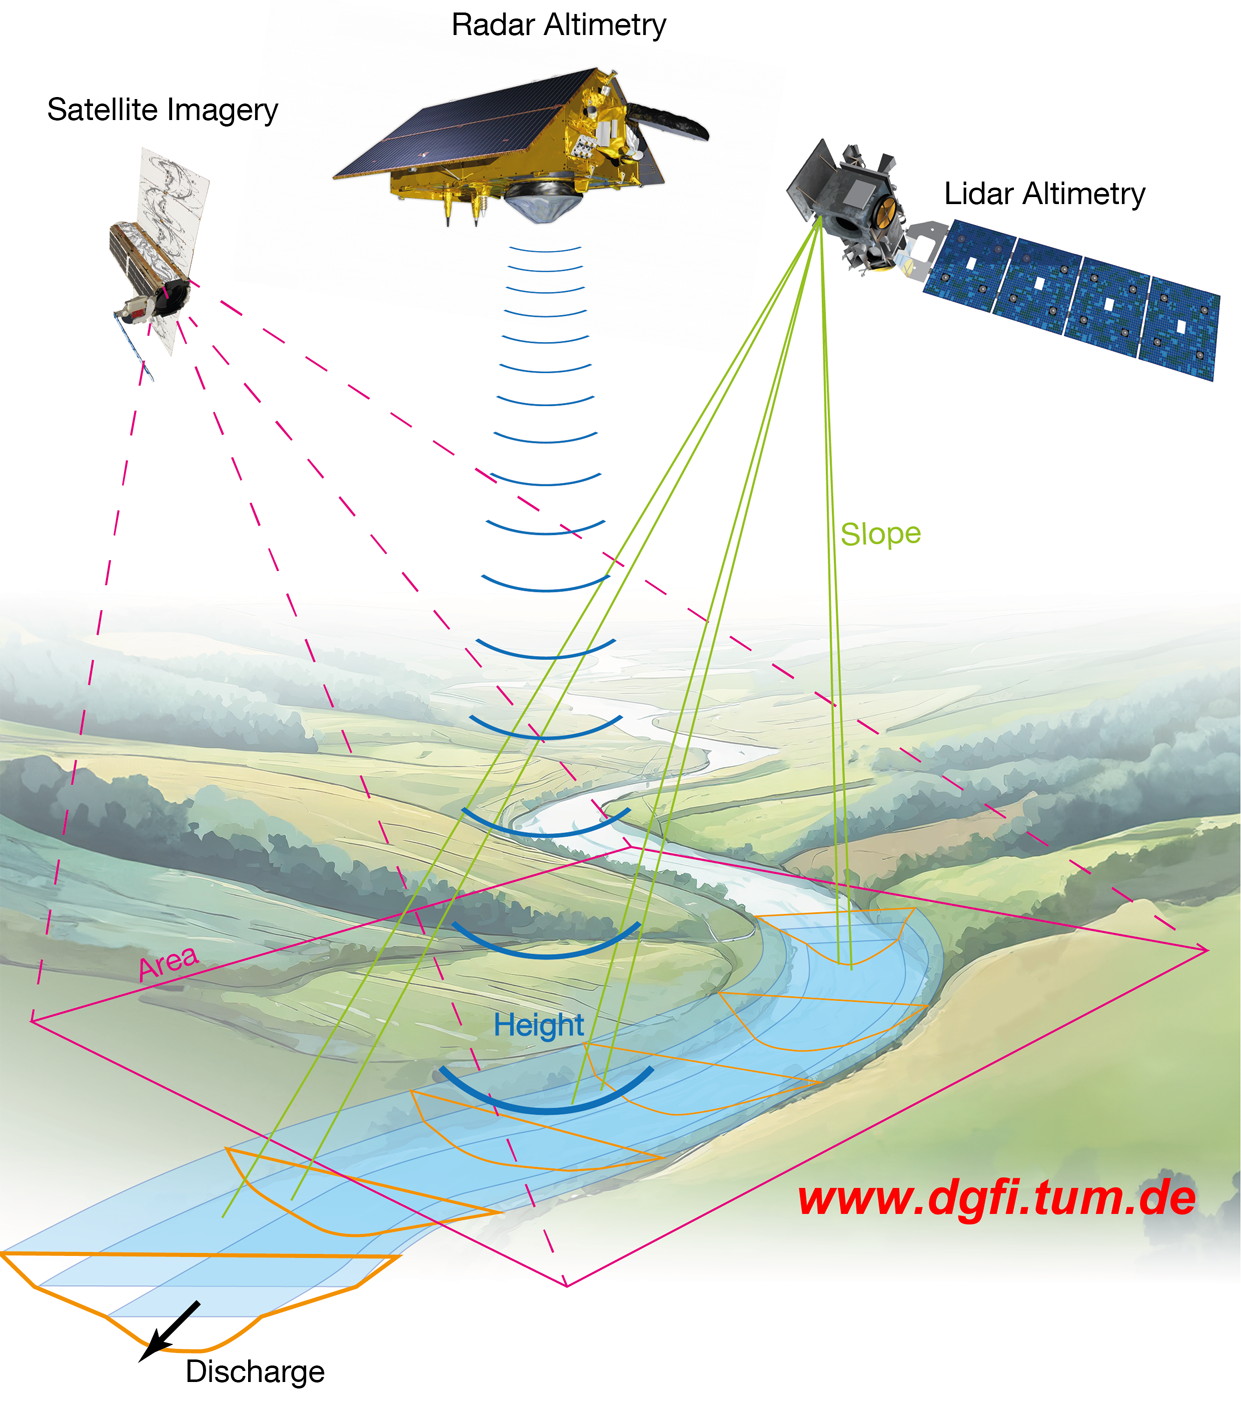
Satellite Monitoring of River Discharge
The majority of the world's population lives close to rivers and uses them as freshwater resources. For sustainable water supply and flood protection, water management decisions depend on accurate, timely and distributed discharge data. River discharge is also one of the Essential Climate Variables (ECVs) defined by the UN Global Climate Observing System (GCOS) to help identify and adapt to changes in the global water cycle and determine the flow of freshwater into the oceans. In-situ discharge measurements, however, are costly and steadily declining, especially in remote areas.
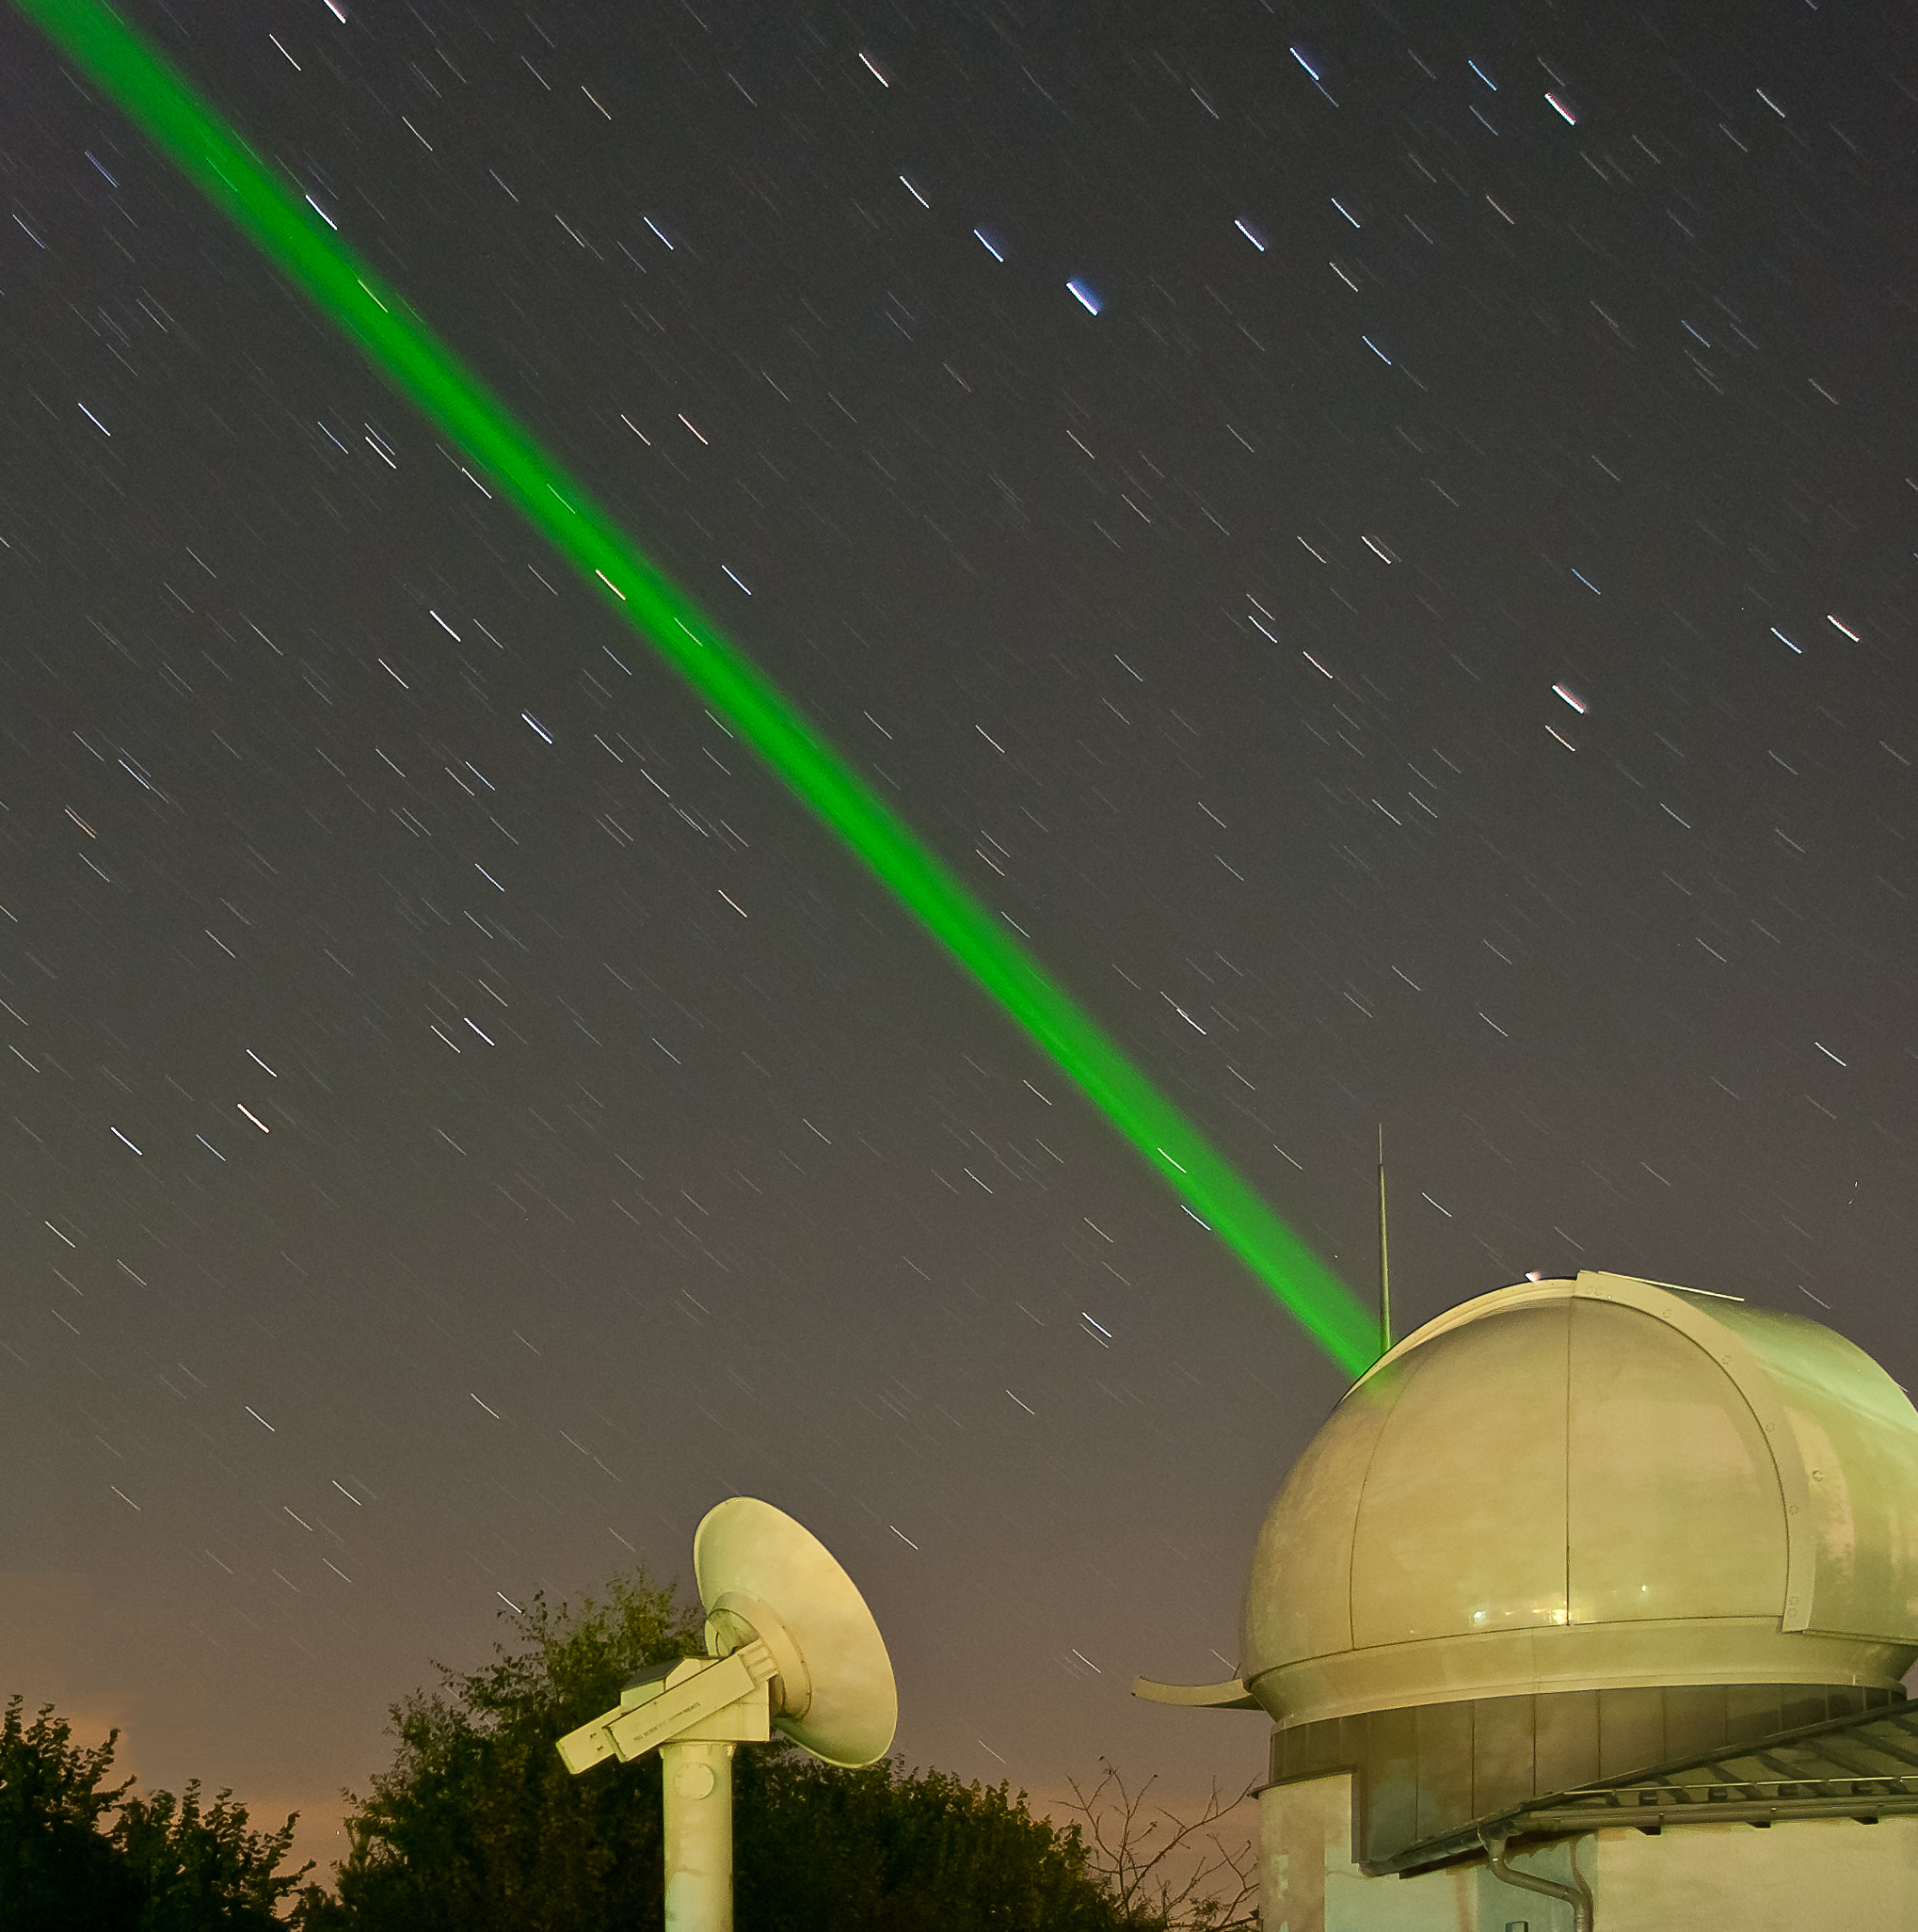
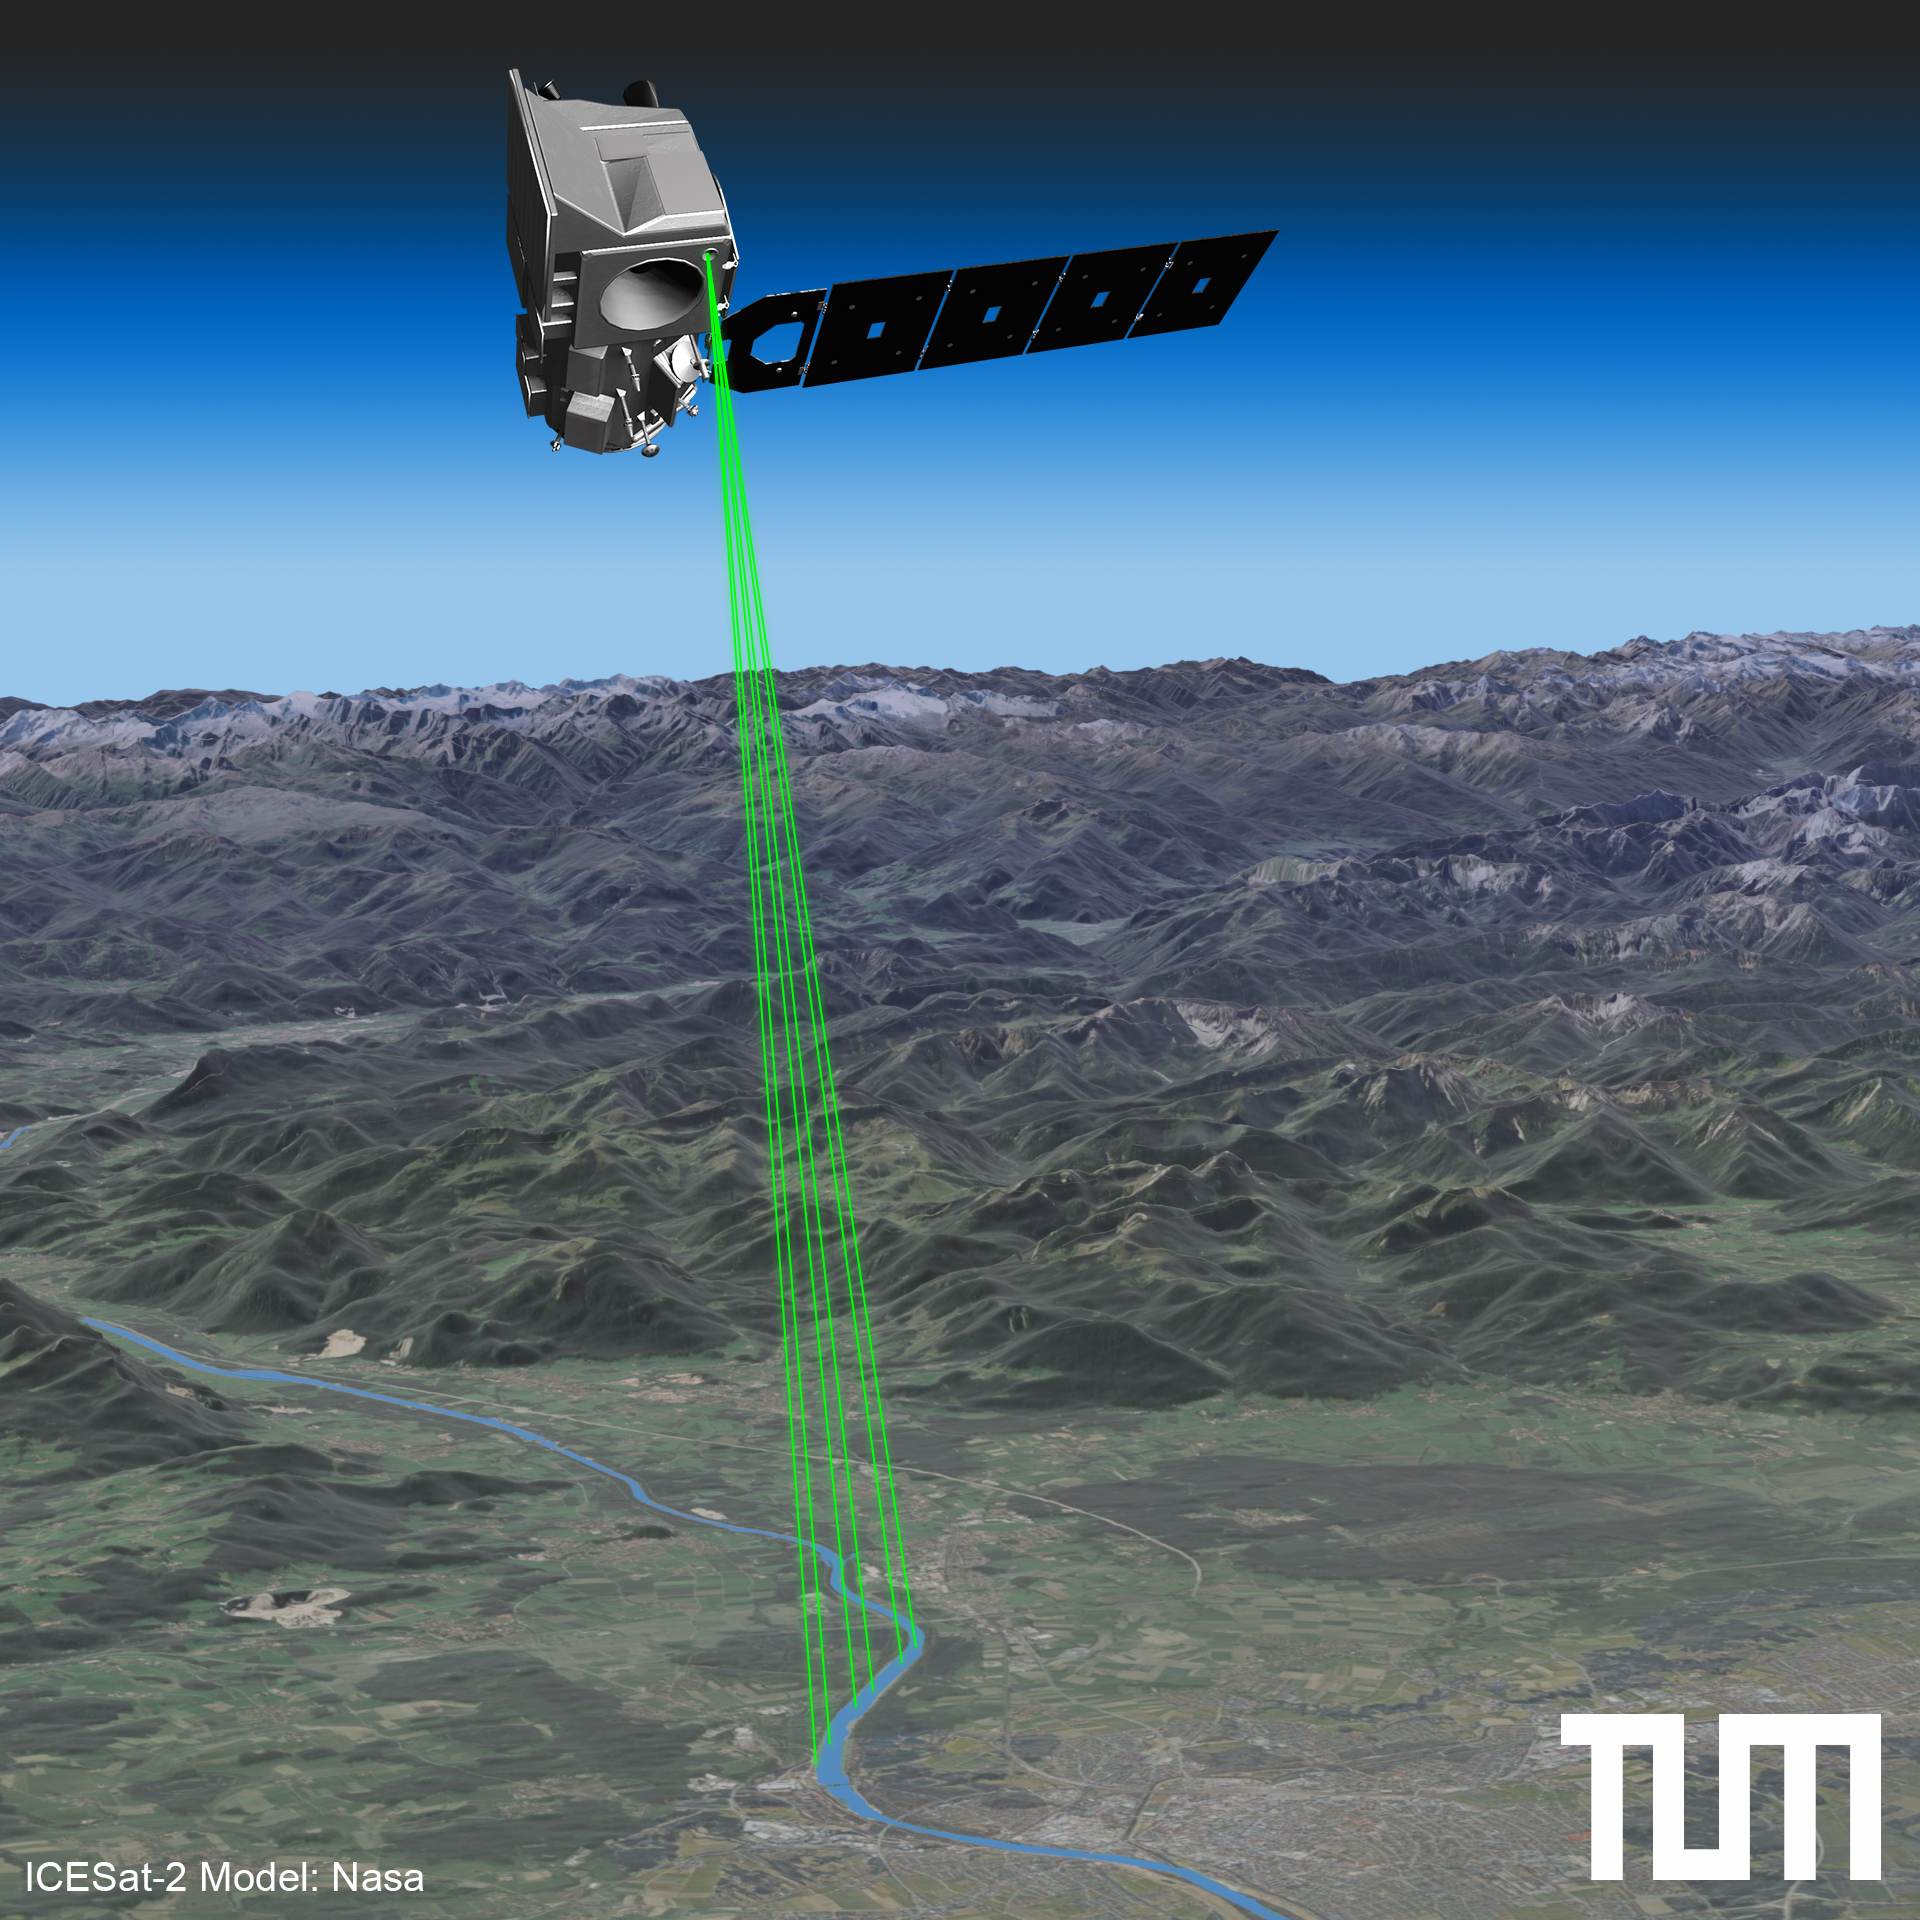
A novel optimization approach has now been developed at DGFI-TUM to increase the global coverage of discharge observations. It combines 20 years of satellite altimetry data with high-resolution satellite imagery and does not require existing in-situ stations for calibration. Small rivers and their width changes can be detected using deep learning classification to reconstruct the river bathymetry. The river slope is determined from precise ICESat-2 lidar measurements. Unknown flow parameters, such as the roughness of the river bed, are optimized according to the principle of mass conservation by minimizing the discharge difference over multiple consecutive cross-sections. Realistic uncertainties, crucial for data assimilation into hydrological models, are provided by taking into account errors and uncertainties in the various input quantities.
The approach is validated globally for 27 river sections with a median error of 12%. On average, the 90% uncertainty range includes 91% of the in-situ measurements. Details can be found in the article Monitoring river discharge from space: An optimization approach with uncertainty quantification for small ungauged rivers (Remote Sensing of Environment, 2024, DOI: 10.1016/j.rse.2024.114434).
Regional changes in relative sea level are strongly influenced by non-linear vertical land motion
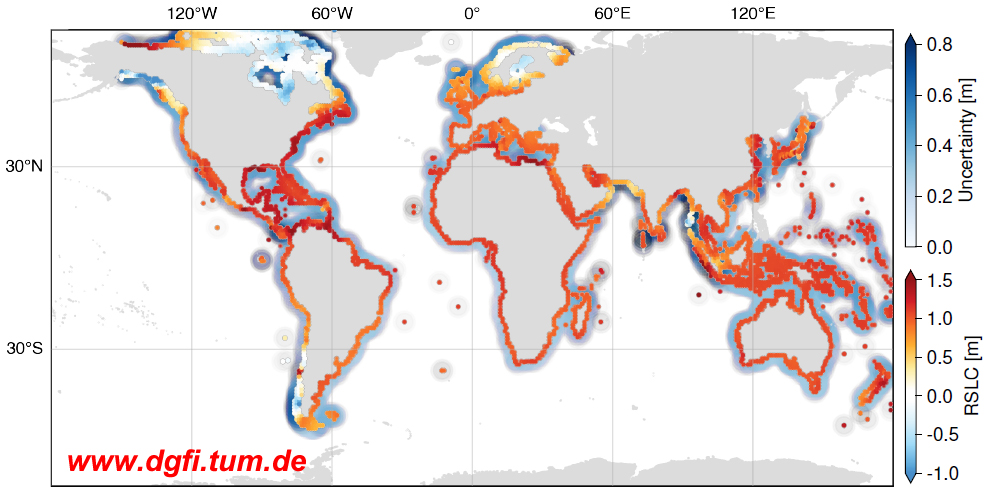
The sea level relative to a coast is influenced on the one hand by climate-driven absolute sea level changes and on the other hand by vertical land motion (VLM). Regionally, the relative sea level change can deviate from the absolute sea level change by several cm/year. Previous sea level projections, such as those in the latest IPCC Assessment Report (AR6), have generally modelled VLM as a linear process, although there is evidence of non-linear movements. These are related to tectonic activity, changes in surface loading or groundwater extraction.
DGFI-TUM has developed a probabilistic global VLM reconstruction for the period from 1995 to 2020 to determine the impact of regional and non-linear VLM on relative sea level projections up to the year 2150. The study shows that the regional differences in projected coastal sea level changes are equally influenced by VLM and climate-related processes, with VLM causing relative sea level changes of up to 50 cm by 2150. The consideration of non-linear VLM increases the uncertainty of the projections by up to 1 m on a regional scale. This emphasizes the uncertainty of future coastal impacts and the importance of including non-linear VLM in sea level projections. Details can be found in the article Regional variations in relative sea level changes influenced by non-linear vertical land motion (Nature Geoscience, 2024, DOI: 10.1038/s41561-023-01357-2).
The VLM reconstruction can be used in research of past, present and future sea level changes, as well as for a variety of other applications, including satellite altimetry, impact assessment studies, and process understanding. Data is available from Zenodo (DOI: 10.5281/zenodo.8308346).
DTRF2020: New realization of the International Terrestrial Reference System (ITRS)
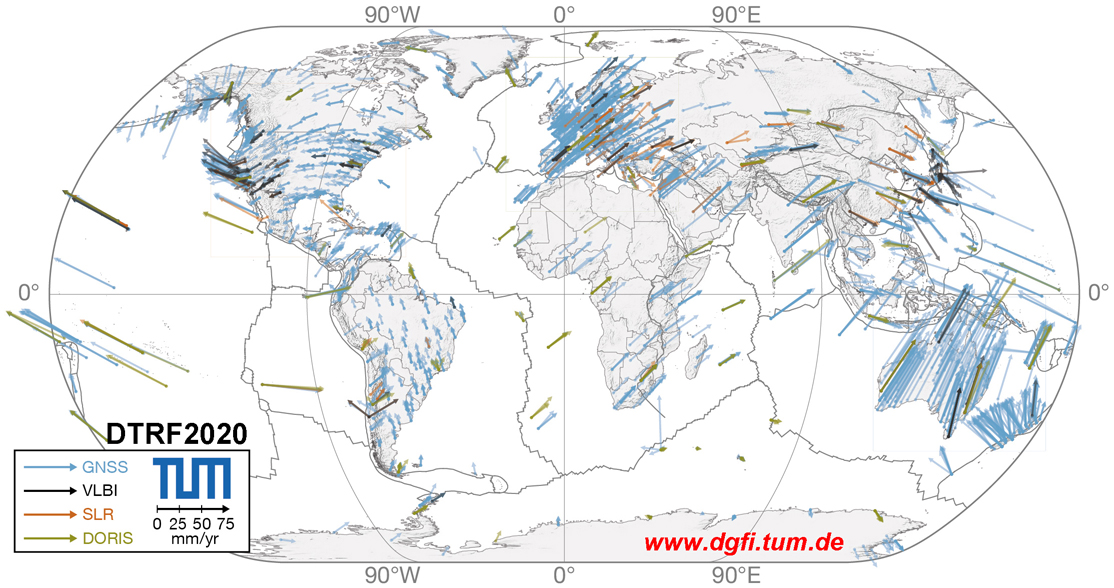
DGFI-TUM has been one of the three ITRS Combination Centers of the International Earth Rotation and Reference Systems Service (IERS) since 2001 and in this role is responsible for the realization of the ITRS alongside the IGN (France) and JPL/NASA (USA). As the fundamental coordinate system of the Earth, the ITRS provides the framework for referencing geodetic and astronomical observations. A highly accurate realization of the coordinate system, the so-called Reference Frame, is of paramount importance for various socially relevant applications including navigation and positioning, and forms the backbone for scientific exploration of the Earth system by providing the reference for monitoring dynamic processes and effects of climate change, such as ice melt or sea level rise.
The DTRF2020 is DGFI-TUM’s latest ITRS realization. It was calculated from the combination of up to 41 years of observation data from the four geodetic space techniques VLBI (Very Long Baseline Interferometry), SLR (Satellite Laser Ranging), GNSS (Global Navigation Satellite Systems), and DORIS (Doppler Orbitography and Radiopositioning Integrated by Satellite), pre-processed and analyzed in a major international effort coordinated by the Scientific Services of the International Association of Geodesy (IAG).
For a global network of 1829 stations, the DTRF2020 contains high-precision coordinates and coordinate changes. It is the only ITRS realization that accounts for station displacements caused by atmospheric, hydrologic, and oceanic mass redistributions (so-called Non-Tidal Loading, NTL). Furthermore, for the first time, the DTRF2020 also considers post-seismic deformation of stations affected by earthquakes. The DTRF2020 release is available via Zenodo (DOI: 10.5281/zenodo.8220523). More information is provided on the website of DGFI-TUM’s ITRS Combination Center at https://dtrf.dgfi.tum.de.
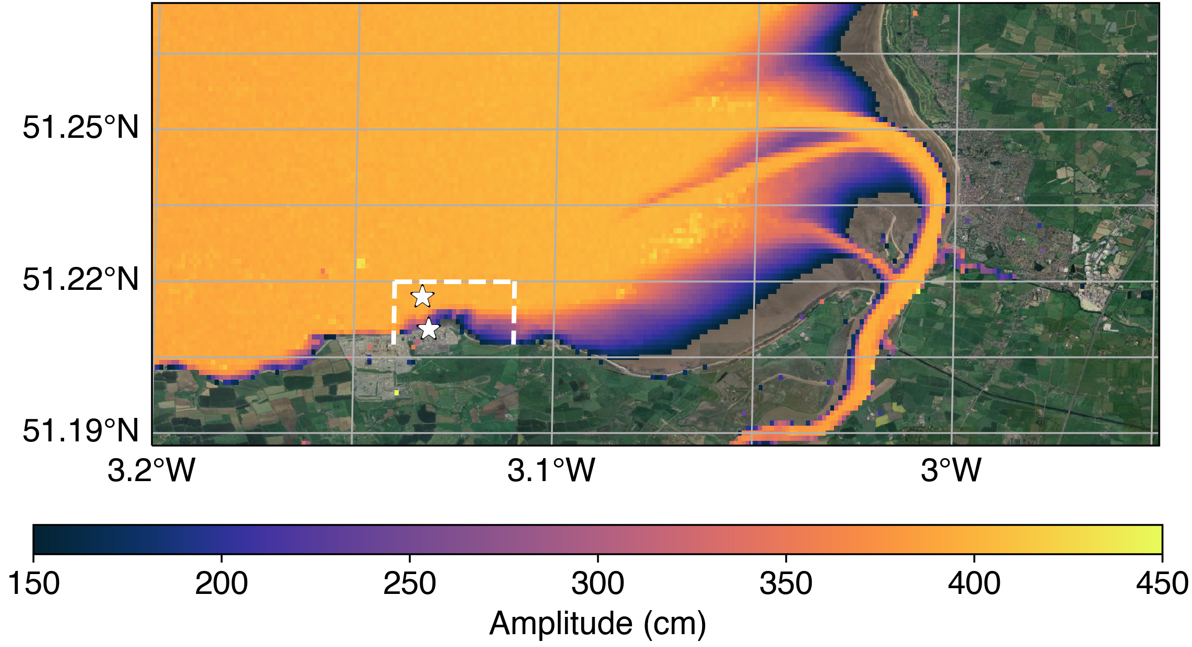
Regional tide model improves water level predictions in the Northwest European Continental Shelf
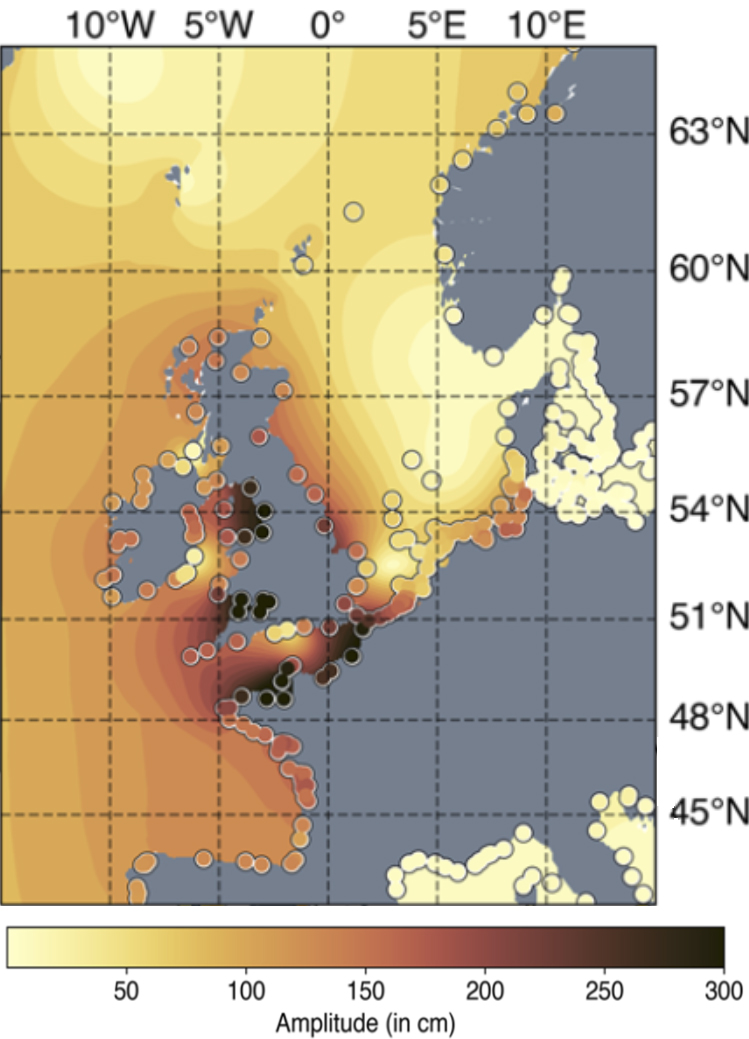
Ocean tides play an important role in coastal protection. When high tides coincide with episodic rises in sea level, such as storm surges, they exacerbate water levels and can cause coastal flooding. This is a worldwide problem, but is crucial in low-lying regions with high tidal ranges. In the Netherlands, for example, preventive measures such as flood barriers have been put in place to address such events. But accurate ocean model predictions are required to determine when to use these measures.
A new regional empirical ocean tide model for the North European continental shelf and the North Sea (EOT-NECS) based on 30 years of altimetry data was developed by DGFI-TUM. It shows consistent improvement over the global tide models EOT20 and FES2014b throughout the area.
A recent study used EOT-NECS as a boundary forcing for the DCSM-FM ocean model of the Dutch Rijkswaterstaat to optimize the model's predictions of total water levels along the Northwestern European Continental Shelf (domain in the Figure). An overall improvement of 0.29 cm and 0.25 cm was found in the model’s tidal height and total water level predictions, respectively. The positive results of the predictions in this study have resulted in Rijkswaterstaat operational forecasts now using the EOT-NECS tidal model as boundary forcing. The two-day forecast can be accessed here: waterinfo.rws.nl/#!/kaart/waterhoogte/
The study is published in the article Altimetry-derived tide model for improved tide and water level forecasting along the European continental shelf (Ocean Dynamics, 2023, DOI: 10.1007/s10236-023-01560-0). The EOT-NECS model, which can also be used in regional altimetry applications, is available from SEANOE (DOI: 10.17882/94705).
IRIS: Global dataset of River Surface Slopes
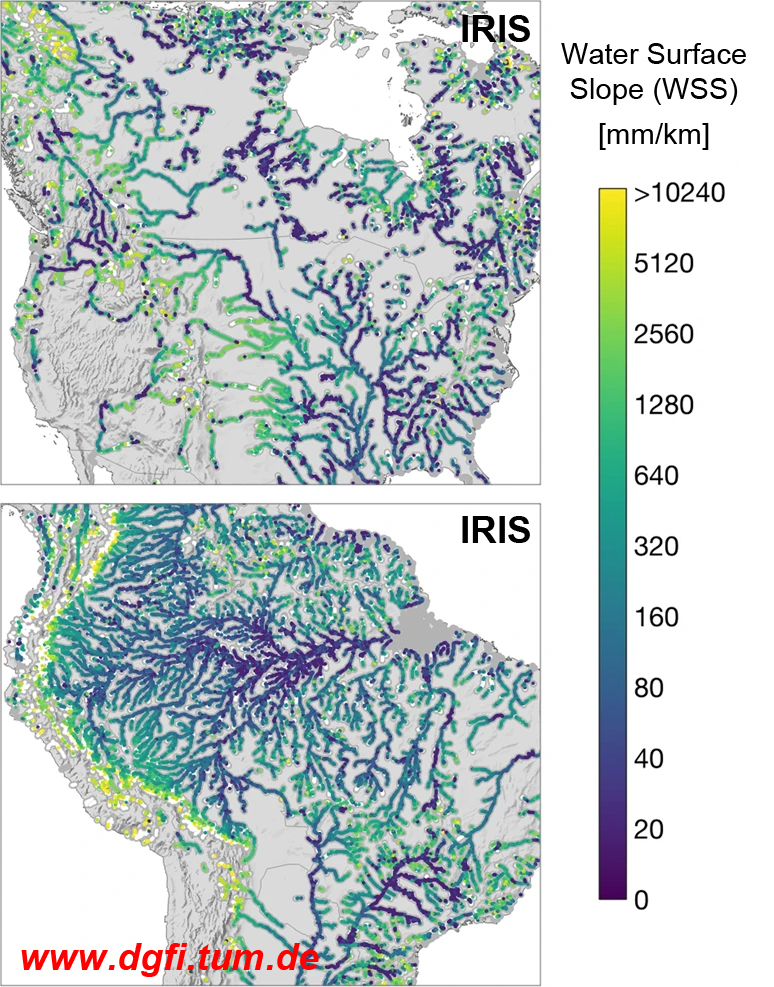
The new ICESat-2 River Surface Slope (IRIS) dataset provides global-scale average and extreme water surface slopes (WSS) determined from ICESat-2 observations. IRIS enables insights into the complex spatio-temporal dynamics of runoff in global river systems. One of the key advantages of IRIS is its reference to the widely used SWOT River Database (SWORD), allowing IRIS to be easily combined with observations from the new SWOT mission.
Accurate WSS data are critical for determining river discharge, one of the Essential Climate Variables (ECV) of the UN Global Climate Observing System (GCOS). In addition, WSS as a correction for the ground track variability of altimetry satellites significantly reduces the error of water level time series.
Global determination of WSS and its spatio-temporal variability is challenging. Global field measurements of WSS are not feasible, long-range interferometric SAR measurements are relatively inaccurate, and gauge stations or virtual stations from radar altimetry lack simultaneous observations over short distances. Using ICESat-2's unique measurement geometry of six parallel lidar beams, WSS of IRIS are calculated over beam pairs or along individual beams, depending on the intersection angle between satellite ground track and river centerline, to ensure maximum spatial and temporal coverage.
IRIS covers WSS between 2018 and 2022 referenced to SWORD(v2). Data is available from Zenodo (DOI: 10.5281/zenodo.7098113). IRIS will be updated progressively by adding future ICESat-2 cycles and new SWORD versions. Data are described in the article ICESat-2 river surface slope (IRIS): A global reach-scale water surface slope dataset (Nature Scientific Data, 2023, DOI: 10.1038/s41597-023-02215-x). More details on methodology and validation are provided in ICESat-2 based River Surface Slope and its Impact on Water Level Time Series from Satellite Altimetry (Water Resources Research, 2022, DOI: 10.1029/2022WR032842). An interactive map of IRIS is available in the Database of Hydrological Time Series of Inland Waters (DAHITI).
Monitoring thin ice and open water in the Arctic Ocean with CryoSat-2 SAR altimetry
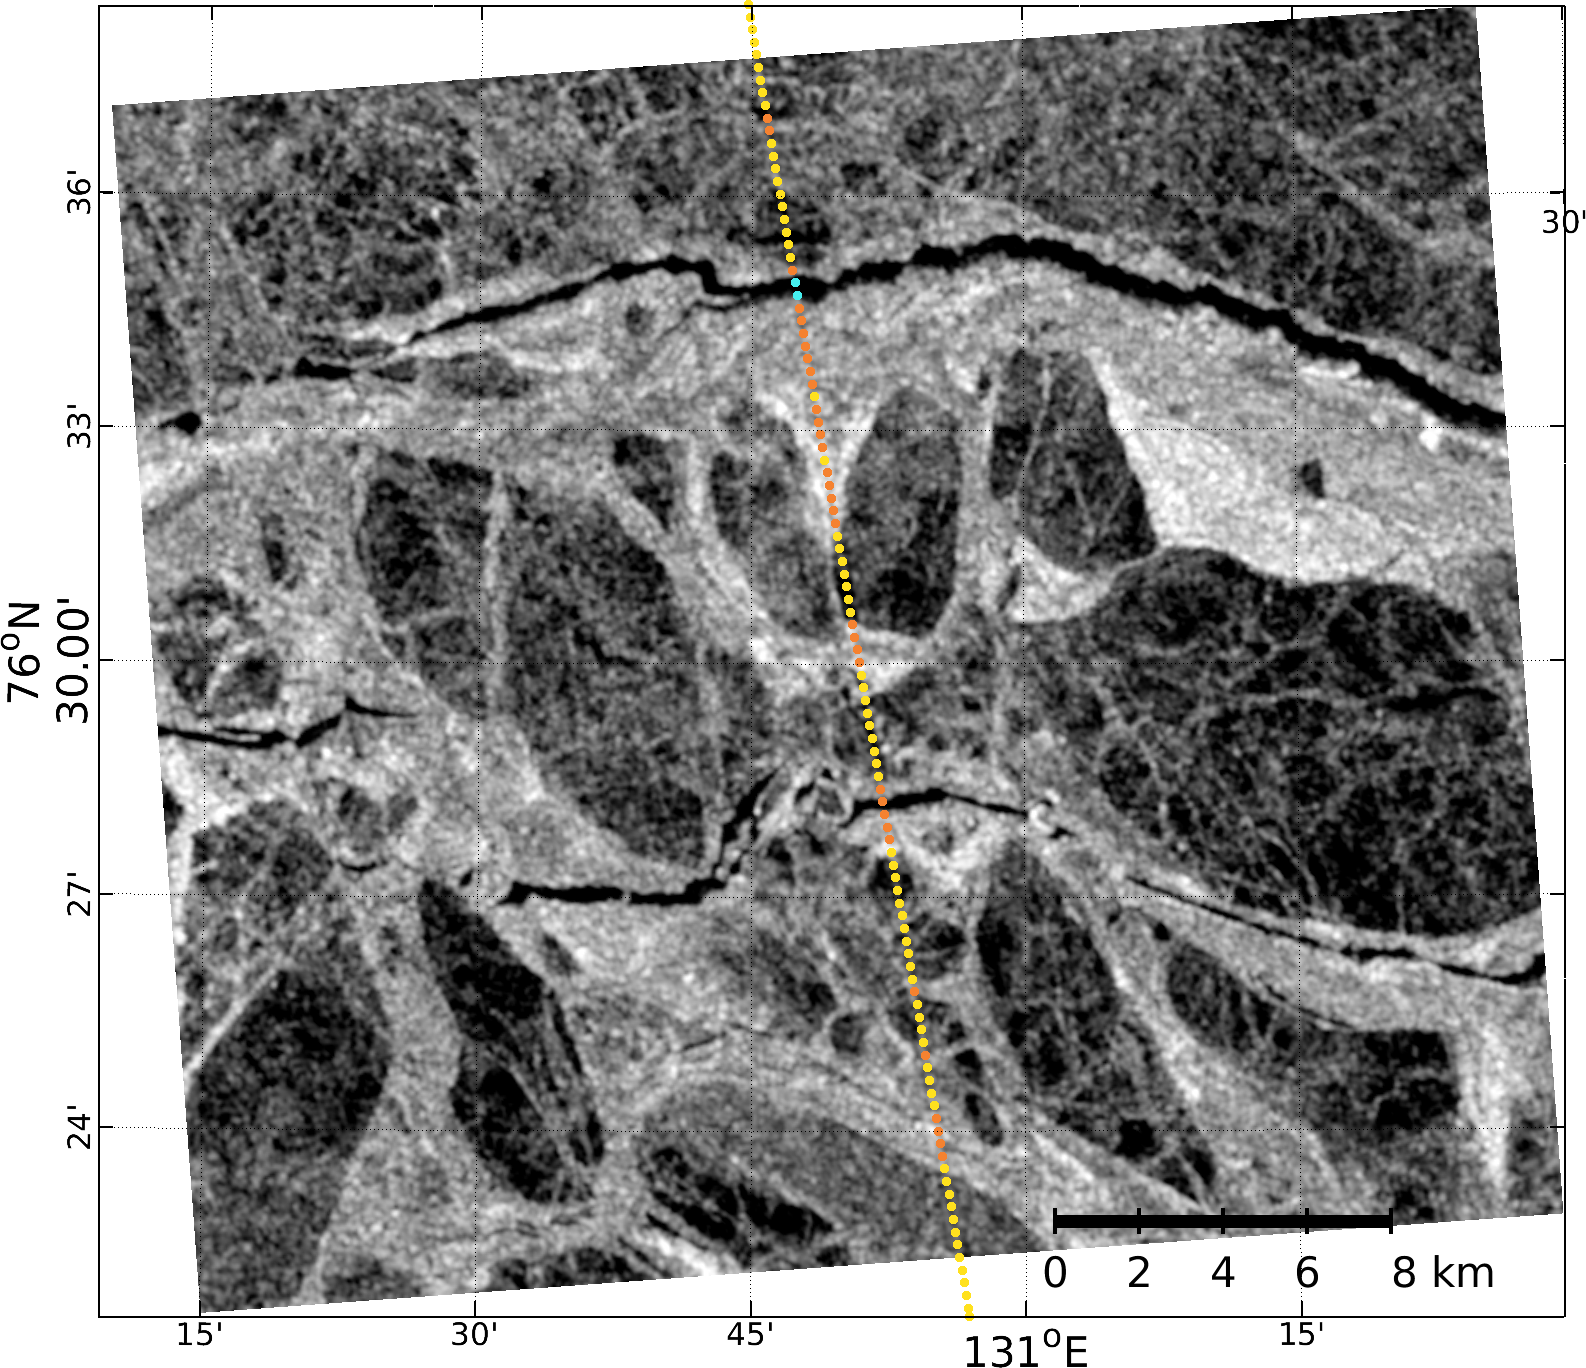
Dwindling sea ice and an increasing number of open water areas have a significant impact on sea ice dynamics in the Arctic Ocean and the energy exchange between ocean and atmosphere. Areas of water (polynyas) and fractures in the sea ice (leads) are not permanently open, but partially frozen and covered by a thin layer of ice, up to about 25 cm thick. The surface temperature of the so-called thin ice is between that of the open water and the thicker sea ice surfaces, affecting the heat flux between ocean and atmosphere. This must be taken into account in climate models and predictions.
DGFI-TUM and the Alfred Wegener Institute (AWI) have jointly developed an unsupervised classification of altimeter radar echoes from ESA's CryoSat-2 for thin ice layer detection. The classification results were compared and validated with thin ice thickness derived from MODIS thermal imagery and with radar images from ESA's Sentinel-1 Copernicus mission.
The results demonstrate how monitoring of the polar oceans can be improved. They contribute to the knowledge of the time-varying Arctic ice cover, particularly by monitoring the overall sea ice thickness distribution. Moreover, the CryoSat-2 classification supports the development of improved waveform retracking algorithms that provide more reliable estimates of sea ice freeboard or sea level in the polar oceans. Details are provided in the article Monitoring Arctic thin ice: a comparison between CryoSat-2 SAR altimetry data and MODIS thermal-infrared imagery (The Cryosphere, 2023, DOI: 10.5194/tc-17-809-2023, [PDF]).
Reached a milestone: DAHITI provides hydrological data for 10,000 targets worldwide
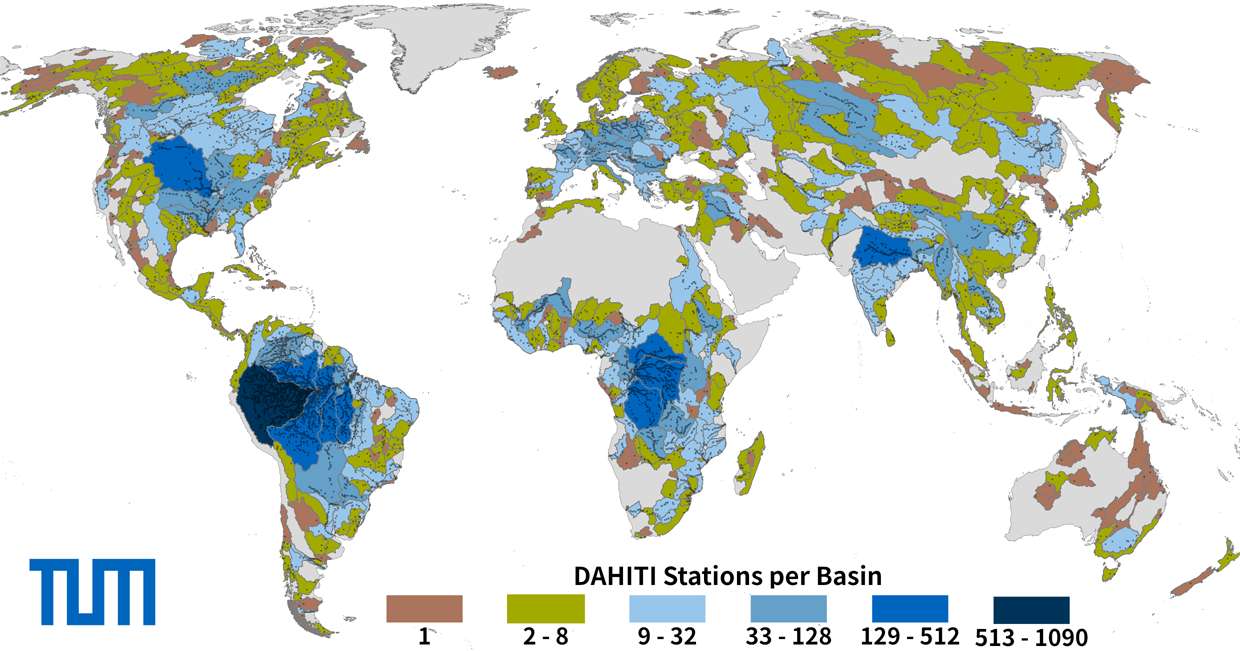
The Database for Hydrological Time Series of Inland Waters (DAHITI) of DGFI-TUM provides free hydrological information for meanwhile 10,000 inland waters distributed worldwide. For rivers, lakes, reservoirs and wetlands, it provides water levels, area and volume changes based on satellite data in near-real-time.
With several thousand registered users and more than two hundred thousand downloads in recent years, DAHITI is a widely used data source for numerous applications in science and practice. The Global Climate Observing System (GCOS) lists the data base as an openly accessible data source for the Essential Climate Variable (ECV) "Lakes". To date, DAHITI provides water level and water extent for more than 1400 lakes and reservoirs, continuously and automatically updated with the latest satellite information.
Station-dependent satellite laser ranging (SLR) correction improves the orbit of the TOPEX/Poseidon altimetry satellite
TOPEX/Poseidon (T/P) was one of the first major altimetry satellite missions. It was operational between 1992 and 2006 and serves as the reference mission for its successors in the Jason and Sentinel-6 series. As such, it is of great importance for studies of global and regional sea level change, ocean circulation, and climate phenomena such as El Niño. With a diameter of over 160 cm, its Laser Retroreflector Array (LRA), the on-board target for Satellite Laser Ranging (SLR) measurements, is not ideally designed for centimeter orbit accuracies. The resulting large phase center fluctuations are a major limiting factor for precise orbit determination of T/P and thus for ocean surface surveys.
Scientists of DGFI-TUM have developed a correction function for SLR observations that resolves LRA-related phase center variations as well as effects that depend on satellite and observing station, such as range biases. The function uses the viewing angles of the observation to determine a correction value that is added to the SLR distance measurement. Since the function is continuous, interpolation between tabulated values is not required and interpolation errors are avoided. The correction reduces the root mean square (RMS) of the SLR observation residuals (observed - computed) for the entire T/P mission from 33.78 cm to 1.97 cm (1.59 cm for SLR core stations). Details can be found in the article Station-dependent satellite laser ranging measurement corrections for TOPEX/Poseidon (Advances in Space Research, 2023, DOI: 10.1016/j.asr.2022.09.002). The station-dependent correction parameters are published as a supplement to the article, so that the measurement correction can be implemented in any precise orbit determination software.
River slopes determined from spaceborne lidar onboard ICESat-2
Knowledge of the water surface slope (WSS) is essential for estimating the discharge and flow velocity of rivers. These parameters are among the Essential Climate Variables (ECVs) as defined by the Global Climate Observing System (GCOS). They critically contribute to the characterization of Earth’s climate, and their determination on a global scale is thus of great scientific relevance.
Field surveys of WSS are, however, very costly, while remote sensing approaches are limited by several factors. While, for example, wide swath SAR interferometric measurements are relatively inaccurate, precise point measurements of radar altimetry lack simultaneous observations over short distances. This obstructs the observation of WSS that vary greatly in space and time. In contrast, the unique measurement geometry of ICESat-2 with six parallel laser beams enables instant, highly accurate WSS observations. A new approach uses two different methods, depending on the intersection angle between the satellite orbit and the river: If multiple beams cross a river reach nearly perpendicularly, the WSS between the crossings can be calculated with the across-track approach. Otherwise, if satellite orbit and river are nearly parallel, the along-track approach derives the WSS directly from the continuous water level observations along a single intersecting crossing beam. The method can be applied globally, and the long-repeat orbit pattern of ICESat-2 allows continuous WSS monitoring, revealing details of the highly varying WSS with little effort.
WSS is not only relevant for the derivation of river discharge, but also as a correction for the ground track variability of altimetry satellites. In this way, errors at regularly observed sites (so-called virtual stations) can be reduced by up to 30 cm or 66 %. Details of the study are presented in the article ICESat‐2 based River Surface Slope and its Impact on Water Level Time Series from Satellite Altimetry (Water Resources Research, 2022, DOI: 10.1029/2022WR032842).
Long-term measurements document sea level rise in the Arctic
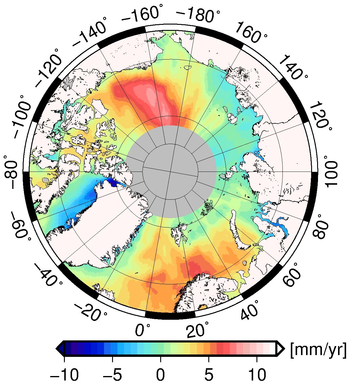
Tracking down climate change with radar eyes: Over the past 22 years, the sea level in the Arctic Ocean has risen an average of 2.2 millimeters per year. This is the conclusion of an investigation performed jointly by DTU Space and DGFI-TUM as part of ESA's Sea Level Climate Change Initiative (CCI) project.
The most complete and precise overview of the sea level changes in the Arctic Ocean to date was obtained after evaluating 1.5 billion radar measurements of various altimetry satellites. A major challenge for a comprehensive analysis is the presence of sea ice which covers vast areas of the Arctic Ocean and obscures the ocean surface underneath. Applying DGFI-TUM's dedicated retracking algorithm ALES+ to ENVISAT and ERS-2 original measurements, radar echoes reflected even from small water openings in the ice could be identified and analysed. After harmonizing observation data from ice-covered and open water areas, maps of monthly sea level elevations were computed for 1996-2018.
Analysis of the long-term measurements revealed significant regional differences of sea level trends: Within the Beaufort Gyre north of Greenland, Canada and Alaska, the water stage rose twice as fast as on average. Low-salinity meltwater collects here, while a steady east wind produces currents that prevent the meltwater from mixing with other ocean currents. Along the coast of Greenland, on the other hand, the sea level is falling, on the west coast by more than 5 mm per year. Here, the melting glaciers weaken the gravity attraction. More information about the study can be found in the open access article Arctic Ocean Sea Level Record from the Complete Radar Altimetry Era: 1991–2018 (Remote Sensing, 2019, DOI: 10.3390/rs11141672, [PDF]). The results are also subject of a current TUM press release (English, German).
DGFI-TUM contributes to the implementation of an UN Resolution for a Global Geodetic Reference Frame
In February 2015, the UN General Assembly adopted its first geospatial resolution „A Global Geodetic Reference Frame for Sustainable Development“. This resolution recognizes the importance of geodesy for many societal and economic benefit areas, including navigation and transport, construction and monitoring of infrastructure, process control, surveying and mapping, and the growing demand for precisely observing our planet's changes in space and time. The resolution stresses the significance of the global reference frame for accomplishing these tasks, for natural disaster management, and to provide reliable information for decision-makers.
The United Nations Global Geospatial Information Management (UN-GGIM) Working Group on the Global Geodetic Reference Frame (GGRF) has the task for drafting a roadmap for the enhancement of the GGRF under UN mandate.
Based on its competence in the realization of reference frames DGFI-TUM is involved in this activity by contributing to the compilation of a concept paper in the frame of the International Association of Geodesy (IAG). The main purpose of this paper is to provide a common understanding for the definition of the GGRF and the scientific basis for the preparation of the roadmap to be accomplished by the UN-GGIM Working Group on the GGRF. [more]
News Archive
-
Novel multi-resolution representation scheme for regional gravity field refinement (2022)
-
Machine learning techniques for Vertical Total Electron Content forecasting (2022)
-
Assessment of non-tidal loading data for DGFI-TUM’s upcoming ITRS 2020 realization DTRF2020 (2022)
-
Improved modeling of atmospheric drag in precise orbit determination (2021)
-
New global ocean tide model EOT20 from multi-mission satellite altimetry (2021)
-
First comprehensive measurements of sea level changes in the Baltic Sea and the North Sea (2021)
-
Global coastal attenuation of wind-waves observed with radar altimetry (2021)
-
Improved parameters of geodetic VLBI by correcting for all types of non-tidal loading (2020)
-
New coastal sea level record from reprocessed Jason satellite altimetry (2020)
-
Adaptive modeling of the global ionosphere Vertical Total Electron Content (2020)
-
Satellite-based time series of volume variations of small inland water bodies (2020)
-
Combining heterogeneous observations in regional gravity field modeling (2020)
-
Wave heights in the ocean: A round robin assessment of satellite altimetry retracking algorithms (2020)
-
Regional high-resolution ionosphere maps for continental regions (2020)
-
Observation-based attitude model improves the orbits of Jason altimetry satellites (2020)
-
High-resolution ionosphere maps for precise GNSS applications (2019)
-
Enhancement of the Global Geodetic Observing System: Where to put the next SLR station? (2019)
-
Time-variable surface areas of lakes and reservoirs monitored from space (2019)
-
Reference Systems – the Backbone for Positioning, Navigation and Earth System Research (2018)
-
The Alps in motion (2018)
-
Coastal altimetry reveals wind-induced cross-strait sea level variability in the Strait of Gibraltar (2018)
-
New approach to estimate thermospheric density from SLR observations of LEO satellites (2018)
-
Resolving water level changes of small rivers with CryoSat-2 SAR altimetry (2017)
-
Next-generation global geodetic reference frames: The potential of Satellite Laser Ranging (2017)
-
Tracking openings in sea ice of the Arctic and Antarctic Ocean (2017)
-
Monitoring the Arctic Seas: Satellite altimetry traces open water in sea-ice regions (2017)
-
Near real-time modelling of the electron content in the ionosphere (2017)
-
Sea level change in the Mediterranean and North Sea with improved coastal performances (2017)
-
High-resolution river water levels based on multi-mission altimetry data (2016)
-
DGFI-TUM releases a new realization of the International Terrestrial Reference System: DTRF2014 (2016)
-
IAG adopts a new conventional value for the reference gravity potential W0 of the geoid (2016)
-
Innovative processing of altimetry data allows for monitoring water levels in wetlands (2016)
Arcisstraße 21
80333 München